
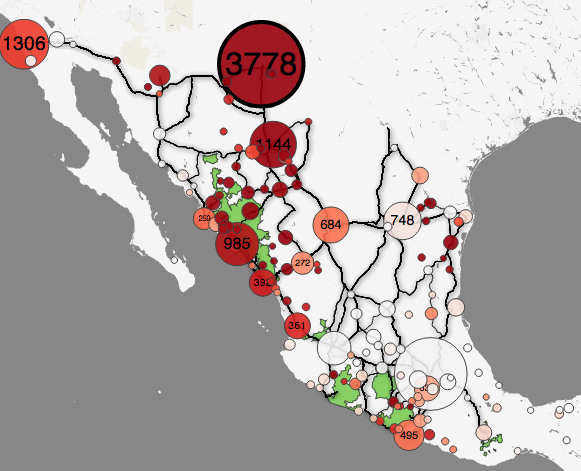
Diego Valle-Jones created an interactive map tracking homicides related to Mexico’s drug war. Data from the map runs from 2004 to 2010 and users can search for marijuana, opium and other drug-related violence.
You can search the map with, or without, the names of cities. You can also zoom in and out of the map to see different details up close. Valle-Jones created the map with data from official Mexican sources.
He wrote about the map on his blog:
The really cool thing about the map is that it makes it very easy to select regions of Mexico and link directly to them, which makes refuting mistaken claims by government officials…a cinch.
He writes about all of the different uses for the map on his blog, but mostly about how it can help empower people to see the drug war from their own perspective — and corroborate claims of official sources. The source code is available for download at GitHub.
Sara Inés Calderón is a journalist and writer who lives between Texas and California. Follow her on Twitter @SaraChicaD.


One Trackback
[…] post originally appeared on Más Wired. var dd_offset_from_content = 35; var dd_top_offset_from_content […]